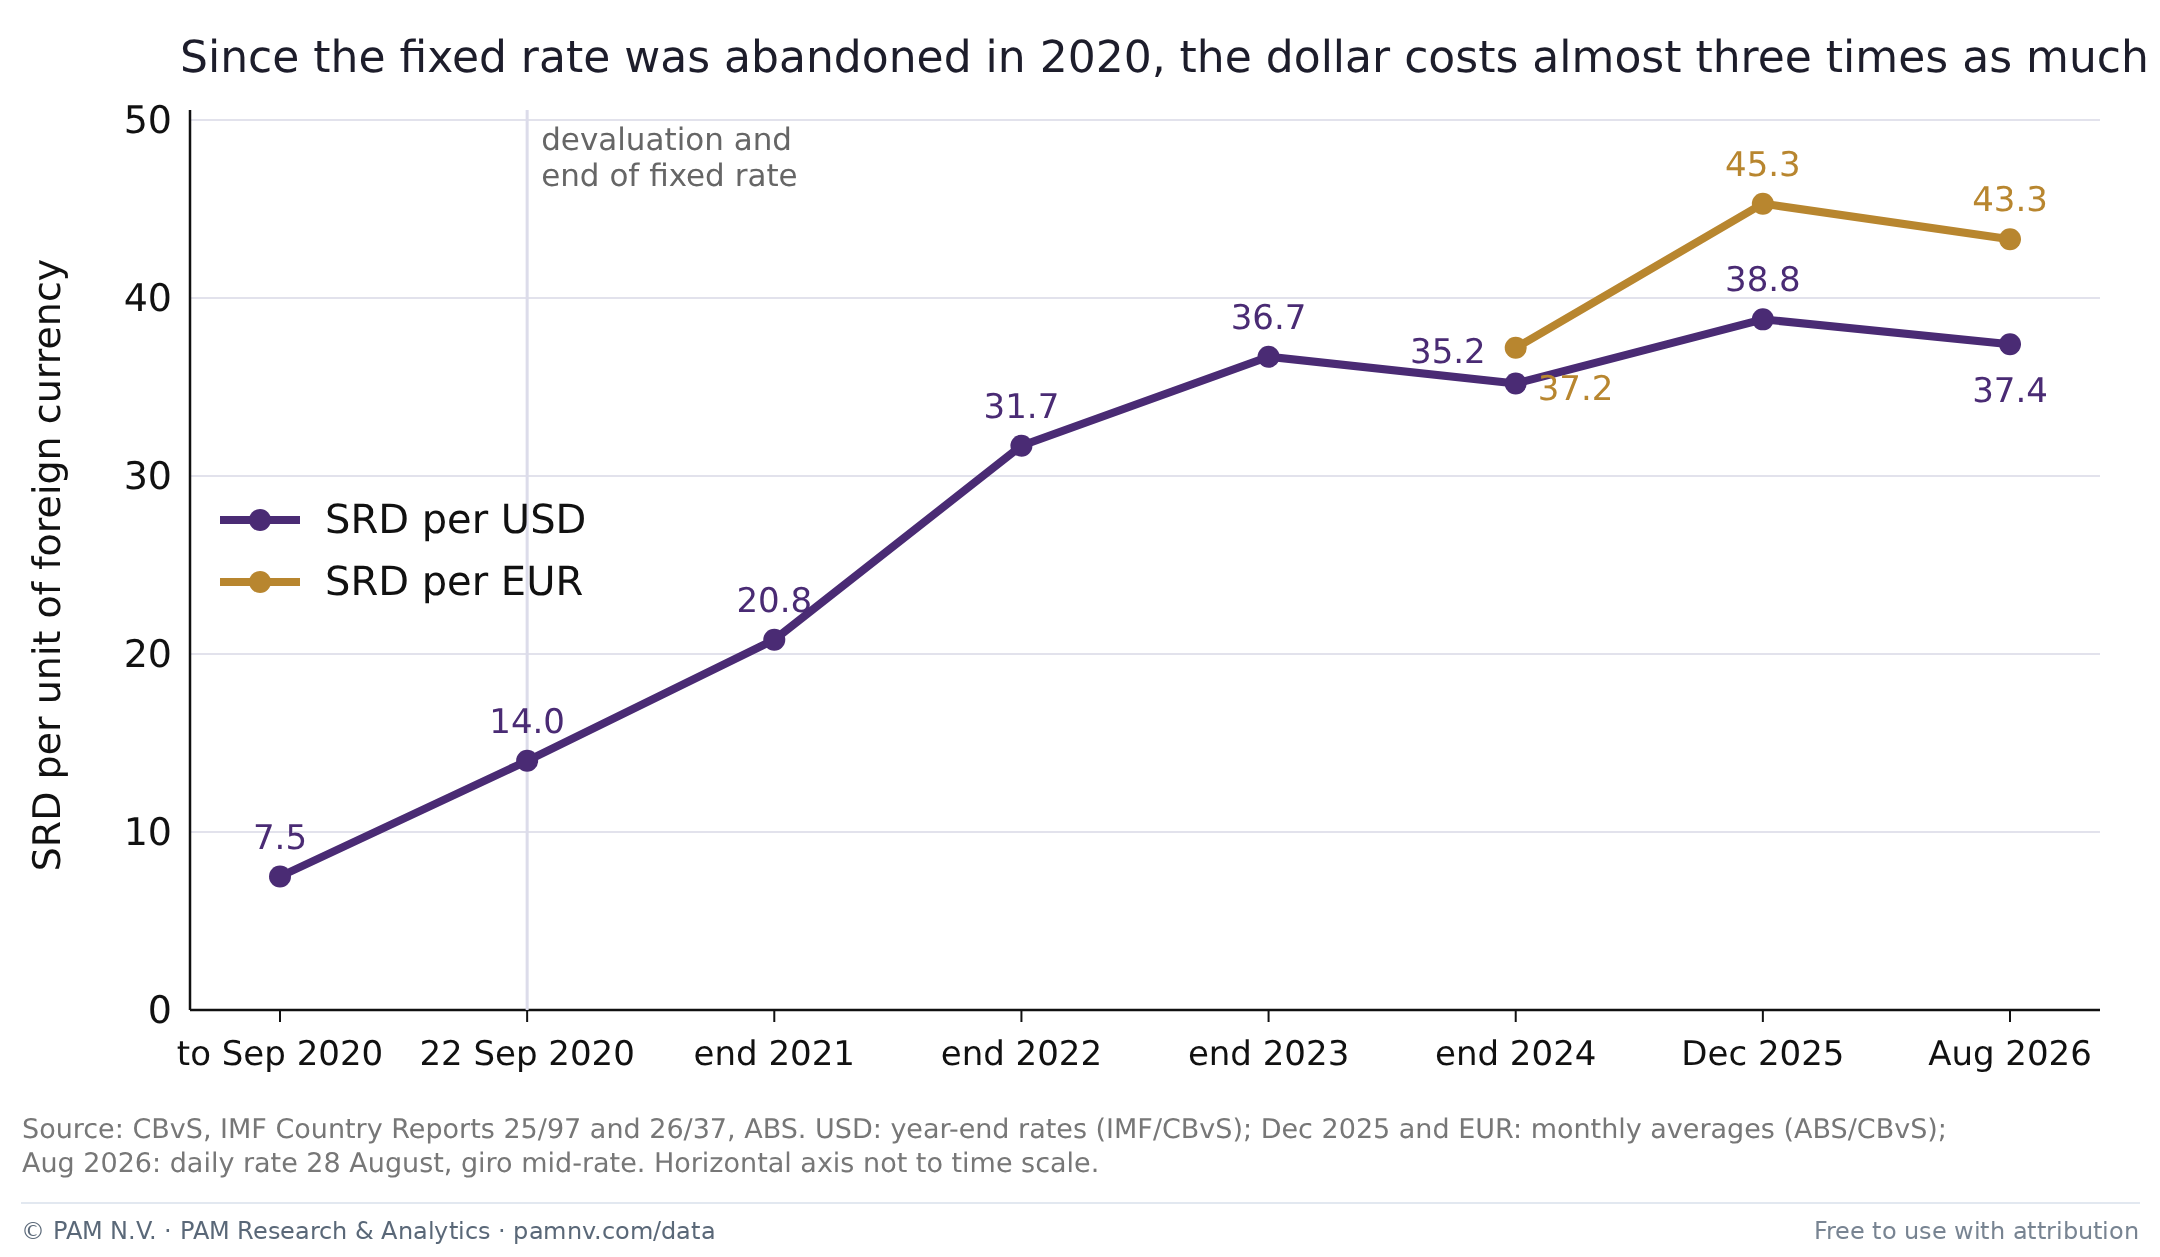
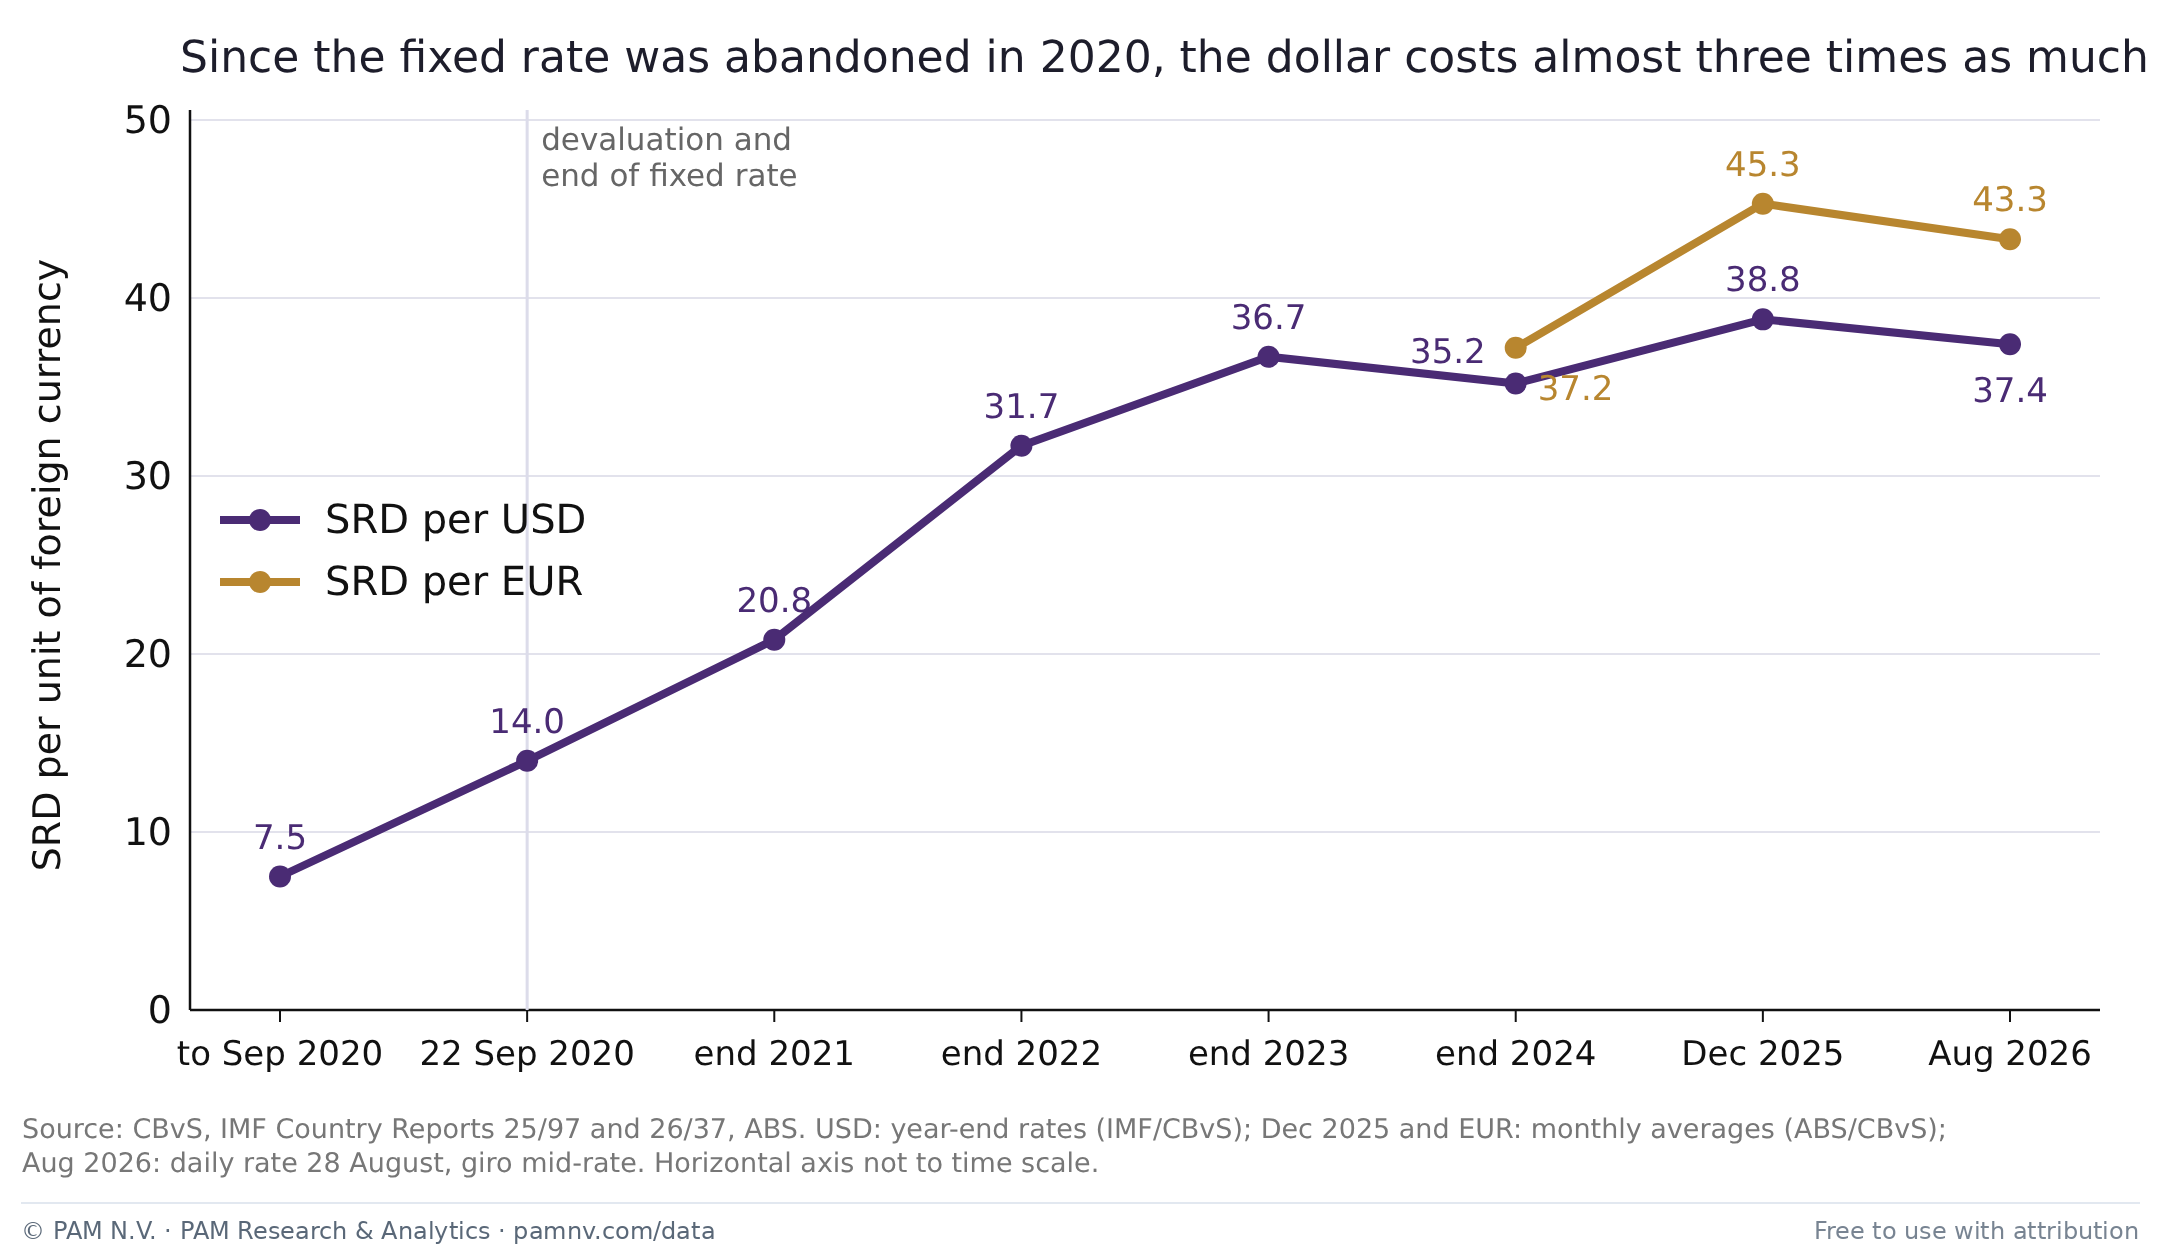
SRD exchange rate per dollar and per euro, 2020–2026
Official SRD rate per US dollar and per euro since the devaluation of September 2020.
Compare with your own figures
Enter your own value per category; the chart shows it as a dashed line next to the PAM series.
Citation
PAM Research & Analytics (2026). SRD exchange rate per dollar and per euro, 2020–2026. In: Why SRD property prices mislead (PAM-SI-2026-02). https://pamnv.com/data/en/srd-exchange-rate-dollar-euro-2020-2026.html
More from this report
ChartConsumer prices, building costs and dollar rate, index 2019 = 100DiagramTwo units of account: supply prices in euros, the buyer earns in SRDChartReal interest rate of the three SRD housing finance regimesChartThe same house, four yardsticksDiagramNumerator and denominator in the same currency: where valuations go wrongDiagramTwo mismatches: the same exchange-rate move, two risks